Tailieumoi.vn biên soạn và giới thiệu các dạng bài tập môn Tiếng Anh gồm các kiến thức lý thuyết và thực hành, các dạng bài tập thường gặp giúp học sinh ôn tập và bổ sung kiến thức cũng như hoàn thành tốt các bài kiểm tra môn Tiếng Anh. Mời các bạn đón xem:
Top 1000 câu hỏi thường gặp môn Tiếng Anh có đáp án (phần 114)
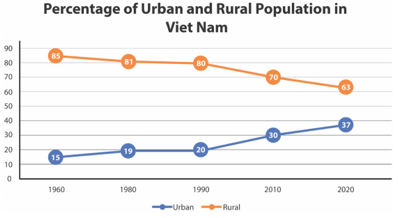
Câu 24: The line graph below illustrates population trends in Viet nam from 1960 to 2020. Write a description (120–150 words) of the graph. Use the expressions in Task 1, the model and tips in Task 2, and the suggestions below to help you.
(Biểu đồ đường bên dưới minh họa xu hướng dân số ở Việt Nam từ năm 1960 đến năm 2020. Viết mô tả (120–150 từ) về biểu đồ. Hãy sử dụng các biểu thức trong Bài tập 1, mẫu và mẹo trong Bài tập 2 và những gợi ý bên dưới để giúp bạn.)
Mẫu 1:
The line graph shows the urban and rural population in Viet Nam from 1960 to 2020. Overall, the urban population increased while the rural population decreased.
In 1960, most Vietnamese people lived in rural areas. However, from 1960 to 1980, the percentage of the rural population fell slightly to 81 per cent. Then the figure remained stable for the next ten years. From 1990 to 2000, the proportion of the population living in rural areas continued to decrease gradually. In 2020, the rural population was only 63 per cent of the total population of Viet Nam.
By contrast, the urban population rose throughout the same period. In 1960, the percentage of the city population was just around 15 per cent. The figure went up slightly in 1980 and remained stable until 1990 when less than 20 per cent of the population lived in urban areas. Since 1990, the proportion of the urban population has increased gradually and in 2020, it reached 37 per cent of the total population.
Hướng dẫn dịch:
Biểu đồ đường thể hiện dân số thành thị và nông thôn ở Việt Nam từ năm 1960 đến năm 2020. Nhìn chung, dân số thành thị tăng trong khi dân số nông thôn giảm.
Năm 1960, hầu hết người dân Việt Nam sống ở nông thôn. Tuy nhiên, từ năm 1960 đến năm 1980, tỷ lệ dân số nông thôn giảm nhẹ xuống còn 81%. Sau đó, con số này vẫn ổn định trong mười năm tiếp theo. Từ năm 1990 đến năm 2000, tỷ trọng dân số sống ở nông thôn tiếp tục giảm dần. Năm 2020, dân số nông thôn chỉ chiếm 63% tổng dân số Việt Nam.
Ngược lại, dân số thành thị lại tăng trong cùng thời kỳ. Năm 1960, tỷ lệ dân số thành phố chỉ khoảng 15%. Con số này tăng nhẹ vào năm 1980 và duy trì ổn định cho đến năm 1990 khi chưa đến 20% dân số sống ở khu vực thành thị. Từ năm 1990, tỷ lệ dân số thành thị tăng dần và đến năm 2020 đạt 37% tổng dân số.
Mẫu 2:
The line graph shows population trends in Vietnam from 1960 to 2020. Overall, the urban population has decreased significantly, while the rural population has increased over the same period.
In 1960, most Vietnamese people (85%) lived in urban areas, with only 15% residing in rural areas. However, from 1960 to 1980, the urban population slightly decreased to 81%, while the rural population rose to 19%. From 1980 to 1990, the urban population continued to decrease to 80%, and the rural population increased marginally to 20%.
A more pronounced change occurred from 1990 onwards. By 2010, the urban population had dropped to 70%, while the rural population had risen to 30%. This trend continued, and by 2020, the urban population had further decreased to 63%, with the rural population increasing to 37%.
Overall, the data indicates a shift from a predominantly urban population to a more balanced distribution between rural and urban residents in Vietnam over the six-decade period.
Mẫu 3:
The line graph provides information about the proportion of urban and rural population in Vietnam between 1960 and 2020.
Overall, what stands out from the line graph is that the percentage of rural population followed an upward trend, while it was opposite for urban.
To commence with, most Vietnamese people lived in urban areas, accounted for 85%, which was the highest number in the chart in 1960. By contrast, this number decreased slightly by 4% in the next 20 years. Moreover, from 1990 to 2020, the percentage of urban population went down significantly, particularly from 80% to only 63%.
A closer look at the remaining data reveals that the proportion of rural population was approximately 15% throughout the same period, which was the smallest figure in the line graph. However, this number increased moderately to 19% in 1980, rising sharply from 20% to 37%, between 1990 and 2020 respectively.
Mẫu 4:
The line graph illustrates changes in the urban and rural population percentages in Vietnam from 1960 to 2020. It is notable that while the proportion of rural residents showed a consistent upward trend, the urban population trended downwards.
Initially, the urban population was predominant, peaking at 85% in 1960, the highest point on the graph. However, over the next two decades, this figure decreased slightly by 4%. From 1990 onwards, there was a significant decline in urban population percentage, dropping notably from 80% to 63% by 2020.
Conversely, the rural population started at approximately 15% in 1960, the lowest point shown. This percentage saw a moderate increase to 19% by 1980 and then rose sharply to 37% by 2020.
Mẫu 5:
The line graph shows population trends in Vietnam from 1960 to 2020. Overall, there is a clear shift from a predominantly urban population to a more balanced urban-rural distribution.
In 1960, a vast majority of Vietnamese people (85%) lived in urban areas, with only a small fraction (15%) residing in rural areas. However, from 1960 to 1980, the urban population decreased modestly, falling to 81%, while the rural population grew to 19%.
The trend continued from 1980 to 1990, with the urban population slightly declining to 80% and the rural population rising to 20%. The most significant changes occurred after 1990. By 2010, the urban population had decreased to 70%, and the rural population had increased to 30%.
From 2010 to 2020, the urban population continued to decline, reaching 63%, while the rural population rose to 37%. This indicates a significant migration from urban to rural areas in Vietnam over the past 60 years, leading to a more balanced urban-rural distribution.
Mẫu 6:
The line graph illustrates population trends in Thailand spanning from 1960 to 2020. Initially, in 1960, the majority of Thai people resided in rural areas, constituting a substantial portion of the population. However, from 1960 to 1980, there was a notable shift as urbanization gained momentum, leading to a steady increase in urban dwellers. This trend continued to surge from 2000 onwards, indicating a significant migration of people from rural to urban areas. Conversely, the rural population exhibited a contrasting trajectory. Despite starting with a higher proportion in 1960, it experienced a gradual decline over the decades, particularly evident in the period from 1980 to 2000. Overall, the graph highlights a substantial urbanization trend in Thailand over the depicted timeframe, reflective of broader socio-economic shifts.
Xem thêm các câu hỏi thường gặp môn Tiếng Anh hay nhất:
Câu 5: Mark the letter A, B, C, or D to indicate the correct answer....
Câu 8: Mark the letter A, B, C, or D to complete each of the given sentences....
Câu 14: Complete the sentences using phrases from 1....
Câu 15: Complete the sentences using the correct forms of the words in 1....
Câu 19: Read the article. Choose the correct meanings of the highlighted words....
Câu 20: Work in pairs. Discuss the following questions....
Câu 21: Work in pairs. Talk about the changes in River City. Use the words and phrases in 1....
Câu 22: Choose the correct meanings of the underlined words....
Câu 23: Work in groups. Discuss the following question....
Câu 25: Read the text and complete the table....
Câu 27: Complete the text, using the correct forms of the words in the box....
Câu 28: Choose the correct answer A, B, C, or D....
Câu 29: Complete the sentences with phrases or clauses in the box based on the conversation in 1....
Câu 30: Complete the sentences with the words in 1....
Câu 31: Combine the following simple sentences, using the words in brackets....
Câu 32: Work in pairs. Discuss the following questions....
Câu 33: Choose the correct meanings of the underlined words and phrases....
Câu 35: Read the texts and answer the questions....
Câu 36: Work in pairs. Discuss the following questions....
Câu 37: Choose the correct words to complete these sentences....
Câu 38: Circle the mistake in each sentence. Then correct it....

CÔNG TY TNHH ĐẦU TƯ VÀ DỊCH VỤ GIÁO DỤC VIETJACK
- Người đại diện: Nguyễn Thanh Tuyền
- Số giấy chứng nhận đăng ký kinh doanh: 0108307822, ngày cấp: 04/06/2018, nơi cấp: Sở Kế hoạch và Đầu tư thành phố Hà Nội.
© 2021 Vietjack. All Rights Reserved.
![]()
 out of the building except by ____ (climb) down a rope")
")
")
